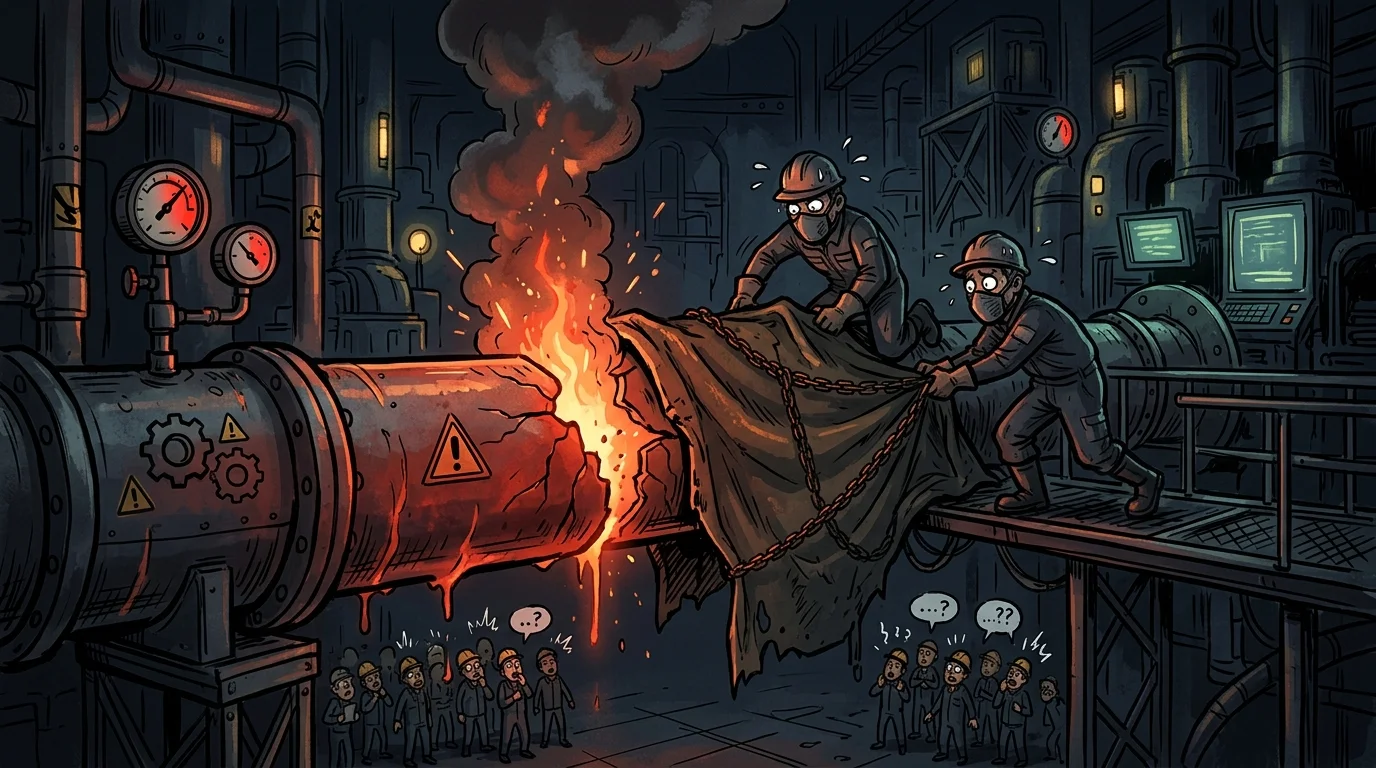
Across digital infrastructure and online services, experience repeatedly confirms one fundamental rule: when official data is missing, human beings fill the void with the worst imaginable outcome.
Early in my journey following operations and digital systems, I witnessed an executive decision that challenged basic operational maturity. Fearing that exposing instability would damage brand reputation, leadership enforced an immediate gag order: preventive maintenance notices were halted, alerts during critical incidents were silenced, release notes were eliminated, and email updates to users were shut off completely.
The implicit reasoning was classic ostrich policy: "if we don't notify the client, maybe they will assume the lag is on their end, and we won't get blamed."
Operational reality, however, extracted an immediate toll in queue spikes, team burnout, and lost revenue. That directive was only abandoned after strong pushback from operations leads armed with ticket backlogs, SLA degradation figures, and direct contract cancellations.
The psychology of the void: why silence amplifies panic#
Suppressing alerts is not merely a public relations blunder; it directly disrupts how the human brain processes uncertainty and risk.
Ambiguity aversion and prospect theory#
Pioneered by psychologists Daniel Kahneman and Amos Tversky, behavioral economics research proves that absolute ambiguity triggers far more negative emotional distress than a known, predictable loss.
A customer who reads a notification stating "we are experiencing 30% latency degradation with full recovery anticipated by 4:00 PM" can adapt, rearrange their workflow, and inform their own clients. A user staring at a frozen interface without a word presumes catastrophic data loss or immediate vendor bankruptcy.
Intolerance of uncertainty#
In cognitive behavioral psychology (notably research by Freeston, Dugas, and colleagues), the absence of feedback fuels catastrophic rumination. Clients do not wait patiently. They enter an urgent state of alarm: they restart connections repeatedly, hammer authentication endpoints with concurrent retries, and flood support queues demanding answers.
The anatomy of operational disaster in metrics#
Corporate silence does not soften a crisis; it shifts the full blast directly onto front-line support staff. When management severs outward communication channels (email, status pages, dashboard banners), operational metrics degrade instantly:
| Operational metric | With proactive communication | Under a policy of silence / concealment |
|---|---|---|
| Incoming ticket volume | Moderate increase of 15% to 25% | Explosion of 300% to 500% (duplicate tickets from single users) |
| Average handle time (AHT) | Stable (standardized, targeted answers) | Increases up to 80% (agents spend time calming angry clients) |
| Resolution CSAT / NPS | Mild drop of 5% to 10% | Sharp drop of 40% to 60% |
| Post-incident retention rate | Maintained (transparency builds trust) | Accelerated direct churn across the subsequent 30 days |
A classic Gartner study on incident response indicates that up to 60% of tickets opened during an outage are duplicate inquiries from users simply asking whether the company is aware of the downtime.
Cutting off outgoing updates channels that entire wave straight onto customer support reps. They spend computational resources and human hours reacting defensively instead of helping validate fixes. I previously explored in depth why your company needs a public status page to break that exact loop.
Real cases: how industry leaders handle disruption#
The difference between companies that endure outages and those that lose enterprise trust lies in how they behave during disruption.
Organizations that turned transparency into authority#
- Cloudflare: During major global disruptions (such as their BGP route leak or the 2019 WAF regex engine freeze), the company set the industry standard by releasing exhaustive technical post-mortems within hours. They published code commits, routing configurations, and corrective safeguards. Rather than triggering client abandonment, they gained immense credibility worldwide.
- AWS and GitHub: Both maintain real-time telemetry dashboards with transparent incident records. Providing detailed logs during disruptions proves to enterprise buyers that the provider operates under strict observability standards and compliance frameworks (like SOC 2 and ISO 27001).
Organizations that concealed outages and paid the price#
- DigiNotar (2011): The Dutch certificate authority suffered an intrusion that resulted in the rogue issuance of wildcard SSL certificates. Instead of alerting customers, industry consortiums, and browser vendors right away, the company concealed the breach for weeks hoping to patch it internally. Once external researchers exposed the hack, browser vendors simultaneously revoked DigiNotar's root trust. Stripped of market confidence, the company collapsed into bankruptcy within weeks.
- Uber (2016): Corporate leadership attempted to conceal a data breach affecting 57 million drivers and riders, disguising payments to the attackers as a "bug bounty" payout backed by non-disclosure agreements without notifying regulatory bodies. The cover-up led to more than $148 million in regulatory penalties, criminal convictions against former security officers, and severe reputational damage.
- Equifax (2017): After discovering a massive data breach caused by an unpatched Apache Struts vulnerability, leadership waited over six weeks to notify the public. That delay and the confusing communications that followed resulted in over $1 billion in legal settlements, executive resignations, and long-lasting harm to market capitalization.
The non-negotiable role of technical governance#
When engineering and operations push to reverse executive gag orders and restore open incident channels, they are not protecting internal pride. They are defending the commercial life of the enterprise.
Hardware failures, routing drops, traffic surges, and application bugs are inevitable across real-world distributed systems. Enterprise customers understand technical failure. What destroys long-term enterprise agreements is discovering that leadership preferred to leave them working blind.
Below, I have organized the templates and frameworks I rely on during production incidents, covering real-time alerts, blameless post-mortems, and B2B contractual SLA enforcement.
Real-time communication templates#
During incident mitigation, predictable and concise updates keep support queues manageable. The rule is simple: always state the current condition, the actual scope of impact, and when the next update will arrive, even while root-cause diagnosis is still underway.
Initial alert (investigation)#
Subject / Title: [Investigating] Service disruption identified on [Service/API Name]

Status: Investigation in progress
Impact: Customers may observe elevated latency or errors [e.g., HTTP 500 / timeouts] when reaching [Feature/Dashboard].
Current action: Our operations team has isolated the anomaly and is reviewing logs and telemetry to identify the cause.
Next update: Within 20 minutes (by [HH:MM UTC]) or as soon as actionable details emerge.
Interim alert (identification and mitigation)#
Subject / Title: [Identified] Mitigation in progress for [Service Name]

Status: Mitigating / Fix rollout underway
Impact: [Specific functionality] remains unavailable for approximately [X%] of users. Other services operate normally.
Identified cause: High connection saturation detected on [e.g., primary database / queue worker / cluster X] following [trigger event].
Current action: We are executing [e.g., database replica failover / release rollback / connection drain] to restore baseline performance.
Next update: Within 30 minutes (by [HH:MM UTC]).
Restoration alert (monitoring)#
Subject / Title: [Monitoring] Services fully restored for [Service Name]

Status: Active monitoring
Impact: Traffic and response latencies returned to normal baselines as of [HH:MM UTC].
Action taken: The [e.g., rollback / node restart and rebalancing] stabilized error rates and request latency.
Status: The environment remains under close watch. An initial incident summary will be shared within [X] hours.
Complete blameless post-mortem template#
This document is compiled once the production environment has fully stabilized. It follows a blameless approach, centering attention on architectural weaknesses, automation gaps, and process improvements rather than personal fault.
# [Post-Mortem] Incident: [Short, descriptive incident title]

**Incident Date:** YYYY-MM-DD
**Document Status:** [Draft / Under Review / Approved / Published to Client]
**Severity Level:** [SEV-1 (Critical) / SEV-2 (High) / SEV-3 (Medium)]
**Incident Commander:** [Name/Role]
**Technical Resolution Lead:** [Name/Role]
**Document Author:** [Name/Role]

---

## 1. Executive summary
A concise overview accessible to technical engineers, business managers, and client stakeholders alike.
* **What happened:** Clear description of the technical disruption.
* **Customer impact:** Percentage of active accounts affected, degraded capabilities, total downtime, and transaction impact.
* **How it was resolved:** The definitive technical action applied to restore normal operation.

---

## 2. Impact metrics
* **Incident start:** YYYY-MM-DD HH:MM [Time Zone]
* **Detection time:** YYYY-MM-DD HH:MM
* **Mitigation start:** YYYY-MM-DD HH:MM
* **Full recovery:** YYYY-MM-DD HH:MM
* **Total duration of degradation:** X hours and Y minutes
* **TTD (Time to Detect):** X min (automated monitoring alert vs. client report)
* **TTR (Time to Resolve):** Y min
* **Accounts affected:** ~X% of active base (or N client accounts)
* **Support tickets opened:** N related customer cases

---

## 3. Detailed timeline
Chronological sequence with precise timestamps retrieved from production logs and response channels.

* **HH:MM** - Trigger event occurs (e.g., deployment of v2.4.1 or sudden traffic peak).
* **HH:MM** - First telemetry alarm triggers (e.g., p99 latency spikes above 3 seconds).
* **HH:MM** - First customer ticket arrives reporting gateway timeouts.
* **HH:MM** - Incident war room established and formal SEV-1 declared.
* **HH:MM** - Initial advisory posted to clients via the status page.
* **HH:MM** - Hypothesis A (upstream network degradation) eliminated following transit path checks.
* **HH:MM** - Root cause isolated to primary database connection pool starvation.
* **HH:MM** - Corrective action completed (connection pool restart and migration rollback).
* **HH:MM** - Latency and HTTP 5xx error rates return to standard baselines.
* **HH:MM** - Final incident resolution advisory published.

---

## 4. Root cause analysis (5 whys technique)
Structured diagnosis focused on identifying architectural gaps rather than individual mistakes.

1. **Why was the service unavailable?**
   The primary database connection pool was exhausted, rejecting incoming web requests.
2. **Why was the pool exhausted?**
   A new query introduced in the latest release lacked an index, forcing continuous full table scans.
3. **Why did the slow query take down the entire system?**
   Threads held connections while waiting on disk I/O for up to 30 seconds without an aggressive application-level timeout.
4. **Why did the unindexed query reach production?**
   The staging database contained limited seed data (1,000 records vs. 15 million in production), masking the query latency during testing.
5. **Why was this missed by the deployment pipeline?**
   The CI pipeline did not include static query linting or automated load verification on realistic dataset sizes.

---

## 5. What worked well vs. what needs improvement

### What worked well
* The p99 latency alert fired within 2 minutes of the initial degradation.
* Client updates were posted within 12 minutes, keeping incoming ticket volume under control.
* The automated deployment rollback executed smoothly per documentation.

### What needs improvement
* Initial triage lost 15 minutes checking unrelated network and firewall logs.
* Database connection dashboards were not immediately visible to on-call support engineers.
* No circuit breaker was in place to isolate the affected endpoint from critical services.

---

## 6. Preventive action plan
Every post-mortem must generate trackable action items with clear owners, deadlines, and issue tracker IDs.

| Preventive action | Type | Owner | Deadline | Issue / Ticket |
| :--- | :--- | :--- | :--- | :--- |
| Configure 3s timeout across all database client pools | Mitigation | @backend-dev | D+3 | `TICK-1021` |
| Add automated SQL index linting to CI checks | Prevention | @devops | D+7 | `TICK-1022` |
| Set up sanitized staging mirror with production scale | Prevention | @infra | D+15 | `TICK-1023` |
| Add connection pool telemetry to primary dashboard | Detection | @sre | D+5 | `TICK-1024` |
B2B communication schedule for SLA breach risks#
In enterprise relationships, how quickly and formally you communicate determines whether a post-outage debrief stays constructive or heads to legal arbitration:
| Phase | Trigger / Timing | Recommended channel | Sender |
|---|---|---|---|
| Phase 1: Proactive warning | Critical SEV-1 ongoing for 30+ minutes (risk of SLA breach) | Formal email copied to account lead | Support lead / Incident commander |
| Phase 2: Formal breach notice | Downtime exceeds contractual threshold | Formal executive email copied to management | Head of operations / VP of support |
| Phase 3: Post-incident review | Within 24h to 48h following recovery | Email with executive post-mortem attachment | Account manager + Technical lead |
| Phase 4: Service credit settlement | Billing cycle or within 5 days of calculation | Formal finance / legal statement | Billing team / Account director |
Template 1: proactive SLA breach risk alert (Phase 1)#
Subject: [Operational advisory] Active incident notification and SLA monitoring – [Your Company]
To: [Client Technical Contact]
Cc: [Account Manager]

Dear [Contact Name],

We are writing to advise you that our operations team identified an issue at [HH:MM UTC] affecting [Service Name], with impact observed on [e.g., user authentication and order processing].

This incident has been prioritized as a critical SEV-1 event and is actively being mitigated by our senior engineering team.

In line with our commitment to transparency under our service agreement, we are informing you that the ongoing resolution effort may approach the contractual SLA downtime limit for the current cycle ([e.g., 99.90% / maximum window of X hours]).

Current operational status:
* Suspected cause under containment: [Brief line, e.g., isolated traffic surge / cluster failover].
* Next formal update: By [HH:MM UTC] or immediately if significant developments occur.

Our priority support channel remains available for your engineering team under ticket #[Number].

Sincerely,
[Your Name]
[Your Role]
[Your Company]
Template 2: formal SLA breach notice (Phase 2)#
Subject: [Formal notice] Operational impact review and SLA breach notification – [Incident ID]
To: [Client Contract Manager / CTO]
Cc: [Account Manager / Legal Counsel]

Dear [Contact Name],

We are providing our formal statement regarding the disruption that affected [Client Company Name] production environments on [YYYY-MM-DD], between [HH:MM UTC] and [HH:MM UTC].

We formally acknowledge that the cumulative downtime exceeded the service availability thresholds defined in our Agreement, constituting an SLA breach for the current period.

Services returned to full stability at [HH:MM UTC] following [summary of resolution: e.g., network route reconstruction and hotfix deployment].

We understand the operational disruption this creates for your business. A comprehensive root cause analysis (RCA) report is being finalized and will be formally delivered by [Date/Time – within 48 hours].

Sincerely,
[Executive Name]
[Head of Operations / Engineering]
[Your Company]
Template 3: delivery of post-mortem and mitigation plan (Phase 3)#
Subject: [Post-mortem completed] Root cause analysis and preventive roadmap – Ref: [Incident ID]
To: [Client Technical Contact]
Cc: [Account Manager]

Dear [Contact Name],

Following our notice sent on [Previous Date], please find attached the official Root Cause Analysis (RCA) report regarding the disruption on [Event Date].

Key findings summary:
* Root cause: [One clear sentence describing the underlying architectural failure].
* Total operational impact: [X hours and Y minutes].
* Immediate action: [Containment measure applied].

Preventive actions underway:
To prevent recurrence, our engineering organization has scheduled the following structural improvements:
1. [Action 1 - e.g., Multi-region redundancy across primary data layer];
2. [Action 2 - e.g., Automated stress testing within deployment pipelines];
3. [Action 3 - e.g., Reduction of automated failover timeouts to under 60 seconds].

We remain available to hold a technical review session with your engineering staff should you wish to review any part of the attached document.

Sincerely,
[Your Name]
[Client Support Lead]
[Your Company]
Template 4: service credit confirmation (Phase 4)#
Subject: [Service credit] Contractual adjustment and credit confirmation – Agreement [Number]
To: [Client Billing Manager]
Cc: [Client Contract Lead]

Dear [Contact Name],

Following the operational incident documented on [Incident Date] (Ticket #[Number]), we have completed our monthly availability audit for the billing cycle of [Month/Year].

In accordance with our contractual SLA schedule:
* Contracted availability: [e.g., 99.90% uptime]
* Recorded availability for the period: [e.g., 98.45%]
* Contractual compensation: [e.g., 15% discount against monthly recurring fee (MRR)]
* Total credit applied: [$X,XXX.XX]

This credit will be applied directly as a deduction on invoice [Date of Next Invoice] listed as: "Service Level Credit (SLA Breach) - Incident [ID]".

Please let us know if your finance team requires additional documentation.

Sincerely,
[Finance Lead Name]
[Billing Operations]
[Your Company]
Contractual SLA and service credit schedule#
To ensure these procedures remain objective and legally binding, enterprise agreements require clear operational definitions. This schedule balances reasonable service guarantees with realistic protections against outside infrastructure failures.
SCHEDULE [X] – SERVICE LEVEL AGREEMENT (SLA) AND SERVICE CREDIT POLICY

This Schedule forms an integral and binding part of the Master Services Agreement entered into between the Parties.

SECTION 1 – OPERATIONAL DEFINITIONS

1.1. Monthly Availability: The percentage of time during a given Calendar Month that the production Services were accessible and operational over the public Internet.
1.2. Downtime (Unavailability): Any continuous period during which the Service is entirely unreachable or returns HTTP 5xx server error rates exceeding 5% across valid client requests, measured by the PROVIDER's internal monitoring systems.
1.3. Scheduled Maintenance: Routine maintenance or infrastructure upgrades communicated to the CLIENT at least 5 (five) business days in advance and executed during standard maintenance windows (00:00 to 05:00 local time).
1.4. Emergency Maintenance: Critical security patching or emergency containment to address zero-day vulnerabilities or imminent hardware collapse, notified with immediate notice or within 2 (two) hours of initiation.

SECTION 2 – TARGET AVAILABILITY COMMITMENT

2.1. Target SLA: The PROVIDER commits to maintain a Monthly Availability of at least 99.90% across production environments during each Calendar Month.
2.2. Calculation Formula: Monthly Availability is calculated using the following formula:

Availability (%) = ((Total Minutes in Month - Eligible Downtime Minutes) / Total Minutes in Month) * 100

Note: In a standard 30-day month (43,200 minutes), the maximum permissible Eligible Downtime to satisfy 99.90% availability is approximately 43 minutes and 12 seconds.

SECTION 3 – EXCLUSIONS (NON-ELIGIBLE DOWNTIME)

3.1. The following conditions do not count as Downtime for the purposes of SLA breach claims or Service Credits:
a) Scheduled and Emergency Maintenance carried out under Section 1;
b) Failures caused by client application code, unoptimized queries, or misconfigurations introduced by CLIENT staff or third parties under their direction;
c) Volumetric Distributed Denial of Service (DDoS) attacks exceeding contractual mitigation tiers;
d) Force majeure events as defined by applicable law;
e) Public utility failures, upstream telecom provider outages, and global Internet routing collapses outside the PROVIDER's direct infrastructure;
f) Service suspension resulting from undisputed client billing delinquency.

SECTION 4 – SERVICE CREDIT TABLE

4.1. If the PROVIDER fails to meet the commitment established in Section 2, the CLIENT becomes eligible to claim a Service Credit calculated as a percentage discount against the monthly recurring charge (MRR) for the affected month:

* Monthly Availability ≥ 99.90%: 0% credit (Commitment met)
* Monthly Availability 99.00% to 99.89%: 10% credit
* Monthly Availability 95.00% to 98.99%: 25% credit
* Monthly Availability < 95.00%: 50% credit

SECTION 5 – CLAIMS PROCEDURE

5.1. Claim Submission: The CLIENT must submit a formal credit request via ticket or written email within 15 (fifteen) calendar days following the close of the affected month.
5.2. Audit and Validation: The PROVIDER will review telemetry and respond with confirmed uptime metrics within 10 (ten) business days.
5.3. Application: Approved credits are applied as a deduction on the next billing invoice. Credits are non-refundable and cannot be converted into cash payments or wire transfers.
5.4. Monthly Cap: Total cumulative Service Credits granted within a single month shall not exceed 50% of the recurring fee for that cycle under any circumstance.

SECTION 6 – EXCLUSIVE REMEDY AND EARLY TERMINATION

6.1. Sole Remedy: The Service Credits outlined in this Schedule constitute the sole and exclusive financial remedy available to the CLIENT regarding operational downtime.
6.2. Chronic Failure Termination: If Monthly Availability drops below 95.00% for 2 (two) consecutive months or across 3 (three) months within any 12-month period, the CLIENT holds the contractual right to terminate the Master Agreement for material breach without penalty or early termination fees.
The practical value of operational truth#
Over years of working around digital services that support thousands of concurrent users, one reality stands out: customers do not expect magic or zero technical flaws. What customers genuinely demand is predictability. They want to know that when something fails, their vendor will not hide behind vague statements or corporate silence.
Choosing secrecy during an outage is a losing strategy that compounds costs: it burns out support staff, breeds distrust across key accounts, and ruins brand equity the moment the inevitable leak occurs. Investing in structured transparency, with visible status pages, blameless reviews, and unambiguous SLA commitments, turns operational disruption into a genuine demonstration of maturity.
Was this article helpful?
Leave a quick reaction to help prioritize future technical guides:
See also


This post is licensed under CC BY-NC.
Comments
Join the discussion below.
0 comments