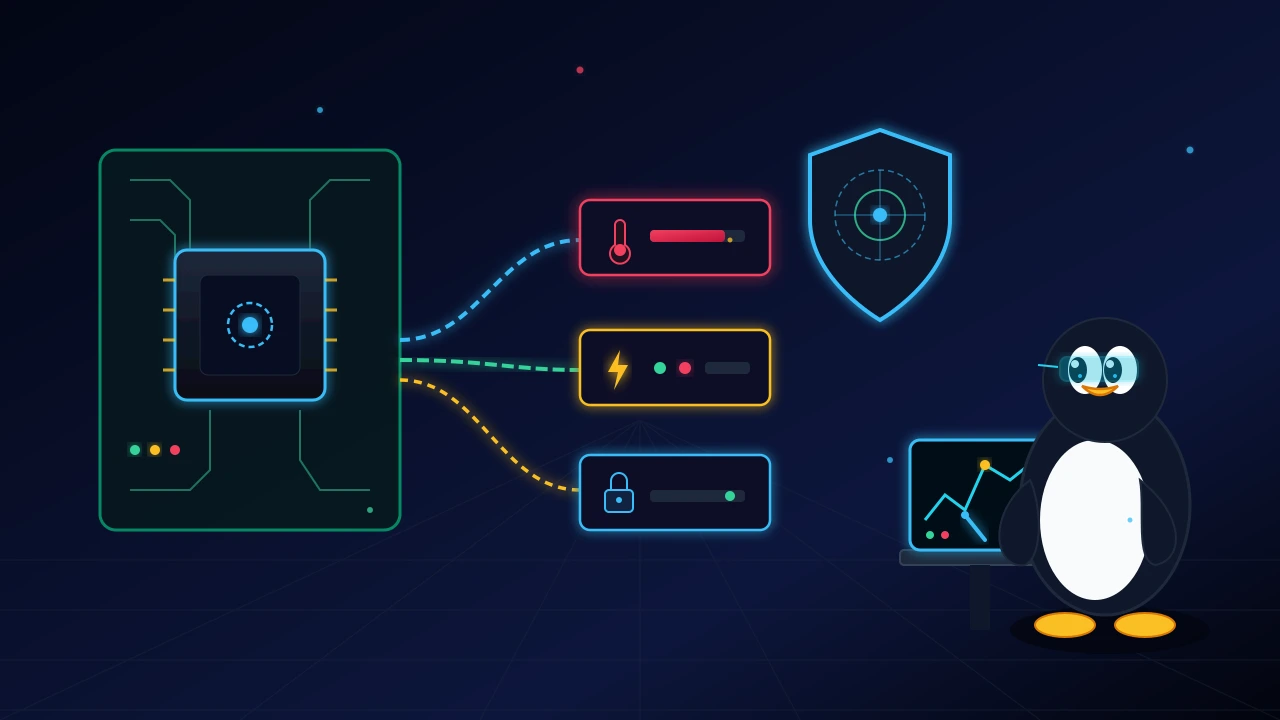
When managing dedicated bare-metal servers or physical clusters, operating system stability directly reflects hardware health. CPU thermal spikes, redundant power supply unit (PSU) faults, ECC memory degradation, and unauthorized chassis openings must be identified before they trigger kernel panics or data corruption.
IPMI (Intelligent Platform Management Interface) and motherboard BMCs (Baseboard Management Controllers) track these physical occurrences continuously, even if the primary host operating system is unresponsive. Integrating this hardware telemetry into Wazuh allows teams to track physical host safety alongside traditional security monitoring.
This guide explains how the Linux kernel interfaces with the BMC, how to collect events through network Syslog or local agents, how to build custom XML decoders and detection rules, and how to configure automated responses for physical emergencies.
1. From silicon to kernel: how Linux communicates with the BMC#
The BMC is an auxiliary microcontroller built directly into the server motherboard. It remains powered as long as the server has electrical connection, regardless of whether the operating system is booted.
The host operating system communicates with the BMC over hardware interfaces such as KCS (Keyboard Controller Style), mapped across system I/O memory spaces.
The ipmi_si and ipmi_devintf kernel modules#
To allow userspace tools like ipmitool to exchange packets with the BMC, Linux relies on two kernel drivers:
ipmi_si: detects physical hardware interfaces via ACPI or SMBIOS tables, registers I/O ports, and handles controller hardware interrupts.ipmi_devintf: creates the character device node/dev/ipmi0, exposing an ioctl API for userspace applications to send commands to the driver.
+--------------------------------------------+
|                 Userspace                  |
|  [ Wazuh Agent ] <---> [ ipmitool ]        |
+--------------------------|-----------------+
                           | open(), ioctl()
+--------------------------v-----------------+
|               Linux Kernel                 |
|  [ /dev/ipmi0 ] (ipmi_devintf)             |
|          |                                 |
|  [ Base System Interface ] (ipmi_si)       |
+----------|---------------------------------+
           | Hardware Bus (LPC / KCS)
+----------v---------------------------------+
|              Physical Hardware             |
|  [ BMC Controller (iDRAC, iLO, Supermicro)]|
+--------------------------------------------+
What happens in the terminal during event extraction#
When running ipmitool sel list, the binary initiates a sequence of system calls:
- Opens the character device
/dev/ipmi0. - Executes
ioctl()requests carrying IPMI command structures across the system bus. - Retrieves raw entries stored in the non-volatile memory (NVRAM) where the BMC maintains the System Event Log (SEL).
You can inspect these calls directly with strace:
strace -f -e openat,ioctl ipmitool sel last 12. Ingestion strategies: collecting BMC telemetry in Wazuh#
There are two primary ways to route hardware events into Wazuh: remote out-of-band Syslog or periodic in-band agent command execution.
Option 1: Remote out-of-band syslog#
In this setup, the BMC web interface (such as Dell iDRAC, HPE iLO, or Supermicro IPMI) forwards Syslog messages over the network to the Wazuh Manager on UDP port 514.
Enable Syslog listener settings in the Manager's /var/ossec/etc/ossec.conf:
<ossec_config>
  <remote>
    <connection>syslog</connection>
    <port>514</port>
    <protocol>udp</protocol>
    <allowed-ips>192.168.100.0/24</allowed-ips>
    <local_ip>192.168.100.10</local_ip>
  </remote>
</ossec_config>
Network buffer tuning for UDP traffic#
Because UDP lacks connection-oriented flow control, bursts of hardware telemetry can saturate Linux socket receive buffers (rmem), causing the kernel to drop incoming packets before they reach wazuh-remoted.
To prevent packet loss during hardware alert storms, increase buffer limits in /etc/sysctl.conf:
sysctl -w net.core.rmem_max=26214400
sysctl -w net.core.rmem_default=26214400
Option 2: Local agent collection (in-band)#
If the BMC cannot route directly to the Wazuh Manager over an isolated management network, the Wazuh agent installed on the host can query the SEL locally.
Add the <localfile> block to the agent's /var/ossec/etc/ossec.conf:
<ossec_config>
  <localfile>
    <log_format>full_command</log_format>
    <command>ipmitool sel last 5</command>
    <alias>ipmi_sys_event_log</alias>
    <frequency>300</frequency>
  </localfile>
</ossec_config>
Every 5 minutes (300 seconds), the agent executes the command, captures stdout output, and sends encrypted payloads over TCP port 1514 to the Manager.
3. Building custom Wazuh decoders and detection rules#
Once hardware logs reach the central server, the analysis engine (wazuh-analysisd) must parse the structured text produced by ipmitool.
Defining custom decoders#
Create the file /var/ossec/etc/decoders/local_ipmi_decoders.xml on the Manager:
<!-- Parent decoder matching IPMI log signatures -->
<decoder name="ipmi_hardware">
  <prematch>^IPMI:|^ossec: output: 'ipmi_sys_event_log':</prematch>
</decoder>

<!-- Child decoder extracting specific event variables -->
<decoder name="ipmi_hardware_sel">
  <parent>ipmi_hardware</parent>
  <regex>(\S+) \|\s+(\S+)\s+\|\s+(\S+)\s+\|\s+([^|]+)\s+\|\s+([^|]+)\s+\|\s+(\S+)</regex>
  <order>ipmi_record_id, ipmi_date, ipmi_time, ipmi_sensor, ipmi_event_description, ipmi_status</order>
</decoder>
Writing detection rules#
Create /var/ossec/etc/rules/local_ipmi_rules.xml to match physical conditions:
<group name="hardware,ipmi,">
  <!-- Base aggregation rule -->
  <rule id="110000" level="0">
    <decoded_as>ipmi_hardware</decoded_as>
    <description>Physical events extracted from IPMI controller.</description>
  </rule>

  <!-- Redundant Power Supply (PSU) failure -->
  <rule id="110001" level="10">
    <if_sid>110000</if_sid>
    <field name="ipmi_sensor">^Power Supply|^PSU</field>
    <field name="ipmi_status">^Asserted</field>
    <description>Critical failure on redundant power supply unit.</description>
  </rule>

  <!-- Critical CPU or system temperature threshold -->
  <rule id="110002" level="12">
    <if_sid>110000</if_sid>
    <field name="ipmi_sensor">^Temperature|^CPU Temp</field>
    <field name="ipmi_event_description">Upper Critical going high</field>
    <description>Critical temperature threshold reached on physical host.</description>
  </rule>

  <!-- Chassis intrusion detection -->
  <rule id="110003" level="9">
    <if_sid>110000</if_sid>
    <field name="ipmi_sensor">^Chassis Intrus|^Physical Security</field>
    <description>Physical security warning: server chassis cover opened.</description>
  </rule>
</group>
4. Validating decoders with wazuh-logtest#
Before reloading configuration files in production, verify pattern matching with Wazuh's interactive tool:
/var/ossec/bin/wazuh-logtestSubmit a sample event string:
ossec: output: 'ipmi_sys_event_log': 002f | 06/18/2026 | 21:22:00 | Temperature #0x02 | Upper Critical going high | AssertedThe output confirms successful parsing across all evaluation phases:
**Phase 1: Completed pre-decoding.
**Phase 2: Completed decoding.
       name: 'ipmi_hardware'
       parent: 'ipmi_hardware'
       ipmi_sensor: 'Temperature #0x02'
       ipmi_event_description: 'Upper Critical going high'
       ipmi_status: 'Asserted'
**Phase 3: Completed filtering (rules).
       id: '110002'
       level: '12'
       description: 'Critical temperature threshold reached on physical host.'
5. Edge cases and troubleshooting hardware collection#
Physical systems introduce operational nuances that differ from standard software monitoring.
Missing /dev/ipmi0 device node#
If running ipmitool returns Could not open device at /dev/ipmi0: No such file or directory:
- Check whether the required kernel drivers are loaded:
lsmod | grep ipmi- Manually load driver modules if missing:
   modprobe ipmi_si
   modprobe ipmi_devintf
dmesg | grep -i ipmi- Keep in mind that standard virtual machines (KVM, VMware) do not expose physical IPMI device nodes to guest operating systems without explicit hardware passthrough.
Sensor flapping and event flooding#
Failing hardware sensors (such as tachometers with intermittent wiring) can flip states hundreds of times per minute. This log flooding can overload Wazuh's analysis daemon.
To mitigate noise, create frequency aggregation rules:
<rule id="110011" level="10" frequency="20" timeframe="60">
  <if_matched_sid>110000</if_matched_sid>
  <same_field>ipmi_sensor</same_field>
  <description>Hardware sensor flapping rapidly within a short timeframe.</description>
</rule>
6. Active response: automated thermal protection shutdown#
Wazuh's Active Response framework can run automated scripts if critical thermal events persist, preventing permanent hardware degradation.
Registering the command in the manager#
Add the following to /var/ossec/etc/ossec.conf:
<ossec_config>
  <command>
    <name>emergency_halt</name>
    <executable>emergency_shutdown.sh</executable>
    <timeout>disabled</timeout>
  </command>

  <active-response>
    <command>emergency_halt</command>
    <location>local</location>
    <rules_id>110002</rules_id>
  </active-response>
</ossec_config>
Creating the executable script on the host#
On the agent machine, create /var/ossec/active-response/bin/emergency_shutdown.sh:
#!/bin/bash
# Emergency host shutdown triggered by Wazuh upon critical thermal events

LOG_FILE="/var/ossec/logs/active-responses.log"
NOW=$(date "+%Y-%m-%d %H:%M:%S")

echo "${NOW} [Active Response] Critical temperature detected. Syncing disks and halting." >> ${LOG_FILE}

# Flush memory buffers to disk before shutdown
sync

# Initiate immediate host shutdown
/sbin/shutdown -h now "Wazuh Active Response: Hardware thermal safety limit exceeded."

exit 0
Restrict permissions so only the Wazuh agent process can execute it:
chown root:wazuh /var/ossec/active-response/bin/emergency_shutdown.sh
chmod 750 /var/ossec/active-response/bin/emergency_shutdown.sh
Best practices for maintaining stable physical telemetry#
Feeding hardware signals into Wazuh surfaces physical issues before they turn into disruptive outages.
To keep telemetry reliable over time:
- Isolate management traffic: maintain BMC network interfaces on an isolated, non-routable management VLAN to protect controllers from unauthorized external access.
- Synchronize clocks: ensure the BMC hardware clock is synced via NTP with the same time source used by the operating system to maintain coherent event sequences during root-cause analysis.
- Correlate hardware events with software outages: sudden application crashes or database unresponsiveness are often preceded by brief power instability or temperature spikes captured minutes earlier in the IPMI event log.
Was this article helpful?
Leave a quick reaction to help prioritize future technical guides:
See also



This post is licensed under CC BY-NC.
Comments
Join the discussion below.
0 comments